MLS - EDUCATIONAL RESEARCH (MLSER)http://mlsjournals.com/Educational-Research-JournalISSN: 2603-5820 |

|
(2024) MLS-Educational Research, 8(1), 145-166. doi.org/10.29314/mlser.v8i1.1679
RELATIONSHIP BETWEEN STUDENT INVOLVEMENT AND ACADEMIC PERFORMANCE IN THE INTRODUCTORY PROGRAMMING COURSE FOR ENGINEERING
Elizabeth Gutiérrez de la Garza
University of Monterrey (México)
elizabeth.gutierrez@doctorado.unini.edu.mx · https://orcid.org/0000-0002-3740-256X
Marco Antonio Rojo Gutiérrez
Universidad Internacional Iberoamericana (México)
marco.rojo@unini.edu.mx · https://orcid.org/0000-0003-4862-8780
Abstract: One of the objectives for economic growth in Nuevo Leon State in Mexico is the development of Industry 4.0 which demands for programming competencies and for the annual rate of degrees in Engineering to increase. Contrastingly, the pass rates in introductory programming course have been lower when comparing them with the rest of engineering subjects at a private university located in the Northeast of Mexico, being this condition a reason for analyzing about the situation based on the Theory of Engagement. The objective of this study was to investigate engagement of the first year engineer student in introductory programming and its relation with academic performance. A correlational study was made on a sample of 123 participants; Blackboard analytics were examined and selected and a correlational analysis was made between Blackboard analytics and academic performance using the final grades by calculating Spearman´s rho coefficient. A moderated relation positive and significative was found between student activity in Blackboard platform and academic performance (rho(116) =.448, p<.001 with statistical power .970) as well as between time invested in Blackboard platform and academic performance (rho(116)=.447, p<.01 with statistical power .995). Because of the relation found, it seems important to frequently monitor the student activity in the platform in order to foster engagement from the early stages of the academic period in introductory programming.
keywords: analytics, engagement, academic performance, introductory programming.
RELACIÓN ENTRE INVOLUCRAMIENTO DEL ESTUDIANTE Y RENDIMIENTO ACADÉMICO EN EL CURSO INTRODUCTORIO DE PROGRAMACIÓN PARA INGENIERÍA
Resumen: Uno de los objetivos de crecimiento económico del Estado de Nuevo León es lograr el desarrollo de Industria 4.0 que requiere el desarrollo de competencias en programación y la graduación anual de más ingenieros. Por otra parte, los porcentajes de aprobación en la materia introductoria de programación han sido menores que en el resto de las materias de ingeniería en una universidad privada del Noreste de México por lo que se ha investigado esta situación con base en teoría del involucramiento del estudiante. El propósito de este estudio fue analizar el involucramiento de estudiantes de primer año de Ingeniería en la materia de programación y su relación con el rendimiento académico. Se diseñó un estudio relacional realizado sobre una muestra de 123 estudiantes de primer semestre, se examinaron y seleccionaron las analíticas que provee el sistema Blackboard y se aplicó un estudio correlacional entre analíticas de Blackboard y el rendimiento académico medido por la calificación final del estudiante mediante el cálculo de coeficiente de Spearman. Se encontró una relación moderada significativa y positiva tanto entre la actividad del estudiante en la plataforma y el rendimiento académico (rho(116) =.448, p<.001 con potencia estadística de .970), como entre el tiempo invertido en la plataforma y el rendimiento académico (rho(116)=.447, p<.01 con potencia estadística de .995). Debido a la relación encontrada, es importante el monitoreo frecuente de la actividad del alumno en la plataforma para fomentar el involucramiento desde etapas tempranas del período académico en la materia introductoria de programación
Palabras clave: analíticas, involucramiento, rendimiento académico, programación introductoria.
Introduction
In Mexico, in the State of Nuevo Leon (2017), there is a great demand for Engineers to lead the digital transformation towards Industry 4.0 which has a strong pillar in Computational Technologies based in turn on programming (PwC, 2020); on the other hand, according to a World Bank report, only 50% of students who start an Engineering program graduate (Ferreyra et al., 2017). One of the main causes of attrition in Engineering programs is failure (Sithole et al., 2017) which can be mitigated by achieving student engagement as will be presented in this study.
In Nuevo Leon, according to the statistical yearbook of the National Association of Universities and Institutions of Higher Education (ANUIES, 2022) for the 2021-2022 school year, there are 73,286 Engineering and Technology students and 10,155 graduate annually. This figure, could be double if all entering students, graduate, considering the World Bank report, (Ferreyra et al., 2017). Nuevo León's strategic plan (2022) for the year 2030 related to economic indicators, contains the objective "3.3 Promote the generation of human capital with a focus on innovation, science and technology" (p. 120), whose indicator is the number of postgraduate graduates per 100,000 inhabitants, which in 2020 was 106 and is expected in a conservative target to be 162 (and with an optimistic target of 262) for the year 2030; it speaks particularly of specialized consulting in Industry 4.0.
The need to have more professionals to take charge of the transformation towards Industry 4.0 has caused a reflection on the pass rates of the introductory subject to programming for Engineers, where the pass rate is lower when compared to other subjects in the area in a private university in the Northeast of Mexico; it is necessary to design strategies based on a diagnosis of the situation. The objective of the study was to investigate the relationship between student engagement and learning outcomes as measured by student academic performance, using learning analytics from the Backboard learning management system (LMS) and based on Engagement Theory.
Burch et al. (2015) find that student engagement in academic courses is among the best predictors of student learning and development.
Engagement is related to retention and student grades. Tinto (2016) identifies three factors that influence motivation to persist: learner self-efficacy, sense of belonging, and perceived value of the curriculum. On the other hand, Yamauchi et al. (2016) argue that engagement is related to student persistence, retention, and grades.
"Regardless of its definition, student engagement is generally positively associated with desirable learning outcomes, both academic, social, and emotional" (Christenson et al., 2012, p. v).
In the systematic literature review conducted by Hernández Barrios and Camargo Uribe (2017) on self-regulated learning (which studies student self-efficacy) in Ibero-America, they found that 42% of the studies have been done in Spain and Portugal and only publications from five of the 19 Countries that make up Latin America were found. Only 11% of these studies analyzed the relationship with academic performance, a situation that constituted another reason to consider their study relevant.
This paper is organized as follows: first the literature review on student engagement research is shown, then academic performance is analyzed, followed by studies on learning management systems. The study hypothesis and the methodology used to test the research model are presented below. It concludes with a discussion of the results found and future work that can be done.
Higher Education Student Involvement
Higher education student engagement has been the subject of study for the last 50 years and is also a research trend as shown by Franklin et al. (2021).
Tight (2020) invites contributions on the topic of student engagement due to its growing importance caused by the flourishing knowledge-based economy. Barbera et al. (2020) explain that, after decades of effort, indicators of student retention and graduation can be identified, one of them being social or academic involvement in the first year of undergraduate studies as a predictor of success, as it is directly connected to persistence to graduation.
Fredricks et al. (2016) explain that engagement has been increasingly studied in the past 20 years for its potential to work with persistent problems in Education, such as student academic performance, attrition, as well as student boredom and isolation. The increase in its popularity is due to the fact that:
It has shown its relationship with academic achievement, lower dropout rate, lower delinquency and depression rate, because it is observable, because all teachers understand it, and because most teachers present disengagement as the biggest challenge they encounter, (p. 2).
"Engagement is attractive because it is malleable to changes a teacher makes in his or her instructional practices" (Fredricks et al., 2016, p. 3).
Tight (2020) states that the more involved a student is with his or her higher education and the institution that offers it, the less likely he or she is to voluntarily drop out without completing his or her studies. Zepke (2018) suggests that learner engagement can serve as an antidote toward learning outcomes that are problematic. Mandernach (2015) reviews the literature for assessing student engagement and the tools that have been used to measure it and indicates that engagement not only includes time spent on a task (behavioral component) but also emphasizes an investment of attention and intellectual vigor, so that engagement has cognitive and affective components.
According to Astin (1984), Fredricks et al. (2004) and Trowler (2010) there is evidence that a high level of student engagement is associated with desirable positive outcomes including increased learning, lower attrition, increased personal development and success, satisfaction, persistence, academic achievement, and social engagement.
Kahu and Nelson (2018), suggest that a known pathway to student success is engagement.
Mandernach (2015) provides the following definitions of involvement, citing their authors; they are presented below in chronological order:
- Astin (1984) defines involvement as "the amount of energy (physical and psychological) that a student devotes to his or her academic experience" (p. 298).
- Natriello (1984) states that involvement includes "participating in the activities offered as part of the academic program" (p. 14).
- Skinner and Belmont (1993) define engagement as a "behavior of sustained intervention in learning activities accompanied by a positive emotional tone" (p. 572).
- Kuh (2003) explains that there is a reciprocal responsibility in fostering engagement, his definition being "the time and energy the student devotes to meaningful activities both inside and outside the classroom, as well as the policies and practices the institution uses to induce the student to take part in these activities" (p. 25).
- Barkley (2010) argues that learner engagement "...does not mean they are being entertained, it means they are thinking" (p. xii).
Christenson et al. (2008) define student engagement as the set of commitments that students make to learn and participate in the educational environment in order to achieve the desired results.
Skinner et al. (2009) define involvement as "the quality of student participation in academic activities, values, and goals" (p. 494).
Kanaparan et al. (2017) set out the following definitions of involvement, citing their authors:
- Fredricks et al. (2004) define academic engagement as the set of psychological and behavioral attempts a student makes to learn, i.e., to master the skills and knowledge of academic activities. Students with high academic involvement will feel that they are accepted and appreciated in their learning activities and this will trigger serious attempts to achieve high academic performance. School engagement is the student's involvement in both academic and non-academic activities that can be observed through their behavior, emotions and cognitive aspects both in the classroom and in school in general.
- Christenson et al. (2012) state that engagement is a multidimensional construct and is defined as "students' active participation in academic and co-curricular or school-related activities and their commitment to educational and learning goals" (p. 4).
- Christenson et al. (2012) add that "learner engagement leads to learning, requires energy and effort, is affected by multiple contextual influences, and can be achieved by all people who want to learn" (p. 4).
Henrie et al. (2015) suggest that academic engagement "is the commitment or attempt a student makes to intervene in the context of academic learning in school" (p. 37).
Tight (2020) also explores definitions of engagement and cites Zepke (2018) who states that learner engagement "is a complex construct used to identify what the learner does, thinks, and feels when learning and how teachers can enhance what is done, thought, and felt in the instructional environment" (p. 695), and invites critique.
Although there are differences in definitions, there is general agreement among authors that there are three dimensions of student engagement: behavioral (behavioral), cognitive and emotional (also called motivational or affective).
The above definitions speak of three interrelated factors: (1) cognitive: the amount of mental effort in the tasks encountered expressed in actions such as thinking, learning, reflecting, enjoying learning and using study strategies; (2) behavioral: the amount of active responses to the tasks presented, manifested in actions such as engaging, investing energy and time, intervening, socializing, interacting and participating in a sustained way; and (3) affective: the level of investment in the learning tasks considering their emotional reactions to these tasks, manifested in their motivation, feelings, gratitude and emotions.
A learning management system stores indicators about the student's active responses during a course, for example, measuring the number of clicks of a student and the time spent on the platform, among others; these behavioral indicators have been considered for the present study and are available at the University.
Due to the relevance of student engagement as discussed above, we have analyzed the relationship between student engagement measured through indicators of the Blackboard platform and their academic performance.
Academic performance
Higher education is a key factor for the development of individuals and countries. Individuals with higher degrees of higher education are more likely to find employment, perform better on various tests, and have better health than their contemporaries (Schneider & Preckel, 2017).
According to a report by the Organization for Economic Cooperation and Development (OECD, 2017), students who complete a Higher Education degree are more likely to be employed and earn higher salaries and are less likely to suffer from depression when compared to their peers who did not complete a Higher Education degree.
In Tinto's (1975) and Bean and Metzner's (1985) models for traditional and nontraditional students, academic achievement is a predictor of persistence. Li and Carroll (2017) showed that being at risk of dropping out is associated with having lower grades than the institutional mean.
The study of academic performance has been a topic of research interest and continues to be studied as an indicator of academic quality. Sakiz et al. (2021) state that academic performance is a reliable measure of the level of knowledge and skills acquired in higher education.
Kumar et al. (2021) have developed a study of definitions of academic achievement over time and have found that they are varied and range "from the achievement of an academic grade to the development of the student in a moral sense," from "passing courses and having knowledge and skills, to developing skills that allow for career advancement" (p. 3091). In general, it is "to ensure and instill a significant change that will occur at the psychological, affective, cognitive and behavioral levels in the learner, which is the ultimate goal of the educational system in the World" (p. 3091).
Academic performance, add Kumar et al. (2021), can be defined as:
The knowledge that is achieved by the student and that is evaluated through grades assigned by the teacher and/or by educational goals established by students and teachers that must be reached in a specific period of time, (p. 3092).
Academic achievement can be understood "as the core around which important components of the educational system revolve and this is why it is a source of attention for researchers, parents, governors and statesmen" (Kumar et al., 2021, p. 3092).
Based on these studies, it was decided to analyze the relationship between student involvement and their final grade in the introductory programming course.
Learning management system
A learning management system (LMS) is a set of digital tools and features designed to facilitate learning and coursework as presented by Dahlstrom and Bichsel (2014) who also claim that its use as a complementary part of a traditional course has been well accepted because it provides many opportunities for learning engagement for both teachers and students.
Curtis (2016) explores methods for measuring engagement in technology-mediated learning experiences and defines it as an agreed-upon, focused, and energetic engagement of the student with their learning. The measures employed should be scalable, cost-effective and minimally disruptive.
Venugopal and Rajashree (2015) studied online engagement in terms of student learning, participation, and academic performance in a blended environment using an LMS. They found that there is a positive correlation between involvement and use.
Lu et al. (2017) assert that when developing learning environments to teach programming, learning and engagement outcomes can be improved by applying Learning Analytics (LA). In their study, they provided the professor with a monthly report on at-risk students using OA in a MOOC (Massive Online Open Course) in programming at a university in Taiwan. The results showed that its use improved learning outcomes and student engagement.
Tempelaar et al. (2020) state that the measurement of learning engagement is a research topic in both Education and Learning Analytics and mention a range of instruments used, such as self-report questionnaires, data logging of technology-based learning systems, think-aloud strategies, and testing. The authors combined a self-report questionnaire with digital tracking during some assessments in a university statistics course and found patterns of engagement that can help design effective interventions.
Gardner et al. (2020) wondered which OA is most suitable in Higher Education and focused on the design of a module in a Computer Science course at the Open University of London that is designed with a CALT (computer aided learning and teaching) environment to find the relationship between the environment and student performance. Their conclusion is that these data are very useful for understanding student engagement behavior in an online environment and that the results were useful for retrospective analysis.
Atwell et al. (2021), found a strong relationship between the delivery of homework and student activities and their academic performance, so they consider that their absence is a high-risk factor in the approval of a subject. Timely submission of assignments and activities is related to student engagement.
Ahmadi et al. (2023) conducted a systematic literature review to detect the main indicators of engagement provided by an LMS; they claim that monitoring and promoting student engagement is a determining factor for its success and that the student activity data provided by an LMS can be used to measure engagement.
Based on the above, it was decided to study the relationship between student engagement measured through Blackboard analytics and academic performance measured by the student's final grade in the introductory programming course.
Research question
Is there a relationship between student engagement as measured by Blackboard analytics in the introductory engineering programming subject and their academic performance as measured by final grade?
Research hypothesis
H0: Student engagement (as measured through Blackboard analytics) is not related to student learning outcomes, being an outcome their final grade.
H1. Student engagement (measured through Blackboard analytics) is related to student learning outcomes, one outcome being their final grade.
Method
To measure the association between two variables (Hair et al., 2020), correlation analysis is used, which is a statistical methodology that attempts to establish the relationship between two or more variables by calculating the correlation coefficient between them. The coefficient varies between -1 and 1, being |1| the perfect correlation and must be statistically significant to be valid. The most commonly used correlation coefficients are: Pearson, Spearman and Kendall.
Pearson's correlation coefficient (Hair et al., 2020) measures the linear association between two quantitative variables and has several assumptions about the data: (a) the variables must be quantitative, (b) the relationship between the variables must be linear and (c) the data must have a normal distribution. If any of the assumptions are not satisfied, Spearman's correlation coefficient should be used and if the variables are qualitative, Kendall's correlation coefficient should be used.
The objective was to develop a cross-sectional quantitative relational study between student engagement measured through Blackboard v9.1 analytics and their academic performance measured through their final grade.
Statistical methodology was applied to find out which hypothesis is true. It is desired that the errors in the acceptance of a hypothesis be of the smallest possible size, typically, we work with α < .05 and β <.20, limits that have been adopted in this study.
First, the analytics of the Blackboard system available at the University and that can be consulted through the course evaluation and reports option were studied; nine reports were found among which two were selected for their relevance to the engagement study: the first one called "User activity in the content areas" shows all the activity of each student during the academic period and the second one called "Course activity information" shows the total time that the student dedicated to the course being active on the platform during the academic period. The details of these indicators are shown in Table 1 and the rationale for the decision on each indicator selected is shown in Table 2.
Table 1
Available reports on analytics in Blackboard v9.1
| Number | Report name |
Description |
|
1 |
User activity in the content areas | Summary of the activity of all users in the course content areas between certain dates specified when requesting the report (maximum six months backward from the day the report is requested). Contains the number of clicks on a certain item, both in a table and graph format and also the number of requests per user to each of the content items and the total per user |
|
2 |
Course activity information | General course activity, sorted by student and date. Data include total time and average time, measured in hours, that each student has in the course |
|
3 |
Course coverage report | Displays information on course elements that have been aligned with University goals |
|
4 |
Course performance | Performance of a course compared to a selected set of targets |
|
5 |
General summary of user activity | Displays user activity for all course areas, as well as dates, times and days of the week for activities |
|
6 |
Course user participation report | Number of user submissions in your course for activities, assessments, discussions, blogs and journals within the chosen time frame |
|
7 |
Student overview for a course | A student's activity in the course, sorted by date. The data includes the total time the student has spent in the course |
|
8 |
User activity in forums | Summary of the activity carried out by the user in the course discussion forums |
|
9 |
User activity in groups | Summary of the activity carried out by the user in course groups |
Table 2
Justification on the use of available Blackboard v9.1 reports
| Number |
Report name |
Decision |
Justification |
|
1 |
User activity in the content areas |
yes |
This report was selected to analyze student activity in the introductory programming course since the theory on engagement, Mandernach (2015), has shown the relationship that exists between student behavior through their actions (behavior) and academic performance. |
|
2 |
Course activity information |
yes |
This report was selected because there is theory (Halverson and Graham, 2019) and Henrie et al. (2015) that demonstrates that learner engagement is related to the time spent on a task. |
|
3 |
Course coverage report |
no |
This report is not active at the University. |
|
4 |
Course performance |
no |
This report is not active at the University. |
|
5 |
General summary of user activity |
no |
The information in this report coincides with the information generated in the first report regarding student activity; it was not selected because it has greater detail that does not add value to the study that has been carried out |
|
6 |
Course user participation report |
no |
This report is developed to comply with certain tuition refund laws in the U.S. and is not used at the University. |
|
7 |
Student overview for a course |
no |
The data matches the data generated in report two, but must be obtained on a student-by-student basis. |
|
8 |
User activity in forums |
no |
In the introductory programming course, discussion forums are not encouraged. |
|
9 |
User activity in groups |
no |
In the introductory programming course, work in pairs is encouraged in the laboratory and in the final project; this work is face-to-face, it is not registered in Blackboard. |
For the above, the study has three quantitative variables: student activity (ACT) from Blackboard report one, time spent by the student (TPO) from report two and student final grade (CF) from the University's central system.
To determine the sample size in the relational study, the suggestions of several authors were analyzed.
According to Hernández Sampieri and Mendoza Torres (2018), a sample size of 82 is suggested for a hypothesis test in a two-tailed correlation study. On the other hand, Morales Vallejo (2012) suggests investigating the relationship coefficient found by other authors to know the expected correlation coefficient and to consult the corresponding tables in Statistics books to find the sample size.
Several studies of correlation between student involvement and academic performance were analyzed, the results of which are shown in Table 3, and with the data obtained a weighted average was calculated to consider a moderate correlation of r =.3 in order to consult the tables that indicate the recommended sample size.
Table 3
Studies analyzing a relationship between student engagement and academic achievement
| Scope |
Coefficient of pearson correlation (behavioral) |
n |
Author(s) |
| Nursing Students in Egypt and Saudi Arabia |
.290 |
425 |
Bayoumy and Alsayed (2021) |
| Psychology students in Uruguay |
.110 |
589 |
Curione et al. (2019) |
| Education students in the Philippines |
.208 |
305 |
Delfino (2019) |
| Business Alumni from two Universities in Sri Lanka |
.452 |
318 |
Glapaththi et al. (2019) |
| Education students in Turkey. (Not first semester) |
.255 |
304 |
Gunuc(2014) |
| University English students in Turkey |
.290 |
294 |
Karabıyık (2019) |
| Students from three universities in Ethiopia (non-first year) |
.548 |
530 |
Meseret and Ananda (2018) |
| Pharmacology students in Jordan |
.774 |
144 |
Qetesh et al. (2020) |
| Nursing students in Iran |
.630 |
310 |
Zare et al. (2017) |
In consulting the tables to find the sample size, it was found to be size 85 with a confidence level α = .05 and statistical power (1- β) of .80; if the power is increased toward .90, the sample size is suggested to be 113.
Santa Barbara (2021) suggests sample size of 90 for a confidence level of α = 0.05 and statistical power of .80. Pértegas Díaz and Pita Fernández (2002) suggest a similar size of 85, in both cases for a correlation coefficient r = .3. The authors suggest adding 10% to the sample size to overcome missing data.
There are also authors such as Clark-Carter (2019) who recommend consulting statistical tables available in Statistics books or using software such as G*Power to calculate the sample size by requesting an a priori study therein. The software was installed and the query was run, finding a sample size of 84 for a statistical power of .80 and 112 for a statistical power of .90.
Based on the authors consulted, a sample size of 125 participants was established for the relational study, representing the recommended sample size plus a percentage for possible missing data.
Subsequently, a non-probabilistic convenience sampling was carried out considering the total number of students who took the subject in the academic period January-May 2022 and a sample of 123 first semester participants was obtained, which included students registered in the introductory course of programming for engineering. Five participants were discarded because they exceeded the number of absences allowed during the semester. For 118 participants, selected analytics were extracted from the Blackboard system and subsequently in the University's central system, their final scores were identified. The data were integrated and anonymized.
When doing a relational study, the data should be examined to find out if they present a normal distribution (Hair et al., 2019) and thus use parametric statistics; if the data follow a distribution different from the normal, nonparametric statistics should be used; the authors explain that to detect whether the data present a normal distribution, the graphic methods that depend on a visual review and the formal methods of hypothesis contrast test where the most used statistics are Shapiro-Wilk and Kolmogorov-Smirnov are known; it is also recommended to observe the descriptive statistics of the behavior of the data, values of skewness and kurtosis close to zero will indicate that the data have a normal distribution. Flores Tapia and Flores Ceballos (2021) explain that the Kolgomorov-Smirnov test should be applied for a sample size greater than 50, as is the case in the present study.
Based on the above, tests were made to decide whether to use parametric or non-parametric statistics to carry out the relational study using SPSS v28 software ; it was found that the data did not follow a normal distribution, so it was decided to carry out a relational study by calculating Spearman's rho coefficient in the same software.
Subsequently, statistical power calculation was performed using the G*Power 3.1 software of Faul et al. (2009) and applying the recommendations of Cárdenas Castro and Arancibia Martini (2014).
With the results obtained, the answers to the hypotheses raised in the study were written.
Results
To carry out the correlation study, we first analyzed the descriptive statistics of the variables studied, the results of which are shown in Table 4.
Table 4
Descriptive statistics of the variables
|
n |
Minimum |
Maximum |
Media |
Standard deviation |
Asymmetry |
Standard error |
Kurtosis |
Standard error |
|
|
ACT |
118 |
35 |
652 |
225.16 |
115.14 |
1.219 |
0.224 |
2.113 |
0.444 |
|
TPO |
118 |
11 |
208 |
56.58 |
33.85 |
1.535 |
0.224 |
3.776 |
0.444 |
|
CF |
118 |
30 |
100 |
76.27 |
15.96 |
-0.896 |
0.224 |
0.490 |
0.444 |
The results of descriptive statistics of the study variables show that the data present a bias when observing their asymmetry, in the case of ACT and TPO they have a positive asymmetry, they present a bias to the right, higher frequencies are associated with lower values of ACT and TPO; in the case of CF a negative asymmetry is observed, a bias to the left, higher frequencies are associated with higher values of CF. In the case of kurtosis, the ACT and TPO values show a positive kurtosis, most of the values are close to the mean. The skewness and kurtosis values (Hair, 2020) would be close to zero if the distribution of these data were normal.
For each variable, a normality test was also performed to decide whether to use parametric (Pearson's correlation) or non-parametric (Spearman's correlation) statistical tests.
The normality test was performed considering the following hypothesis:
H0: ACT and CF data do have a normal distribution
H1: ACT and CF data have a distribution different from normal
The Shapiro-Wilk and Kolmogorov-Smirnov statistics were applied in SPSS v28. The results are shown in Table 5.
Table 5
ACT normality tests: student activity on the Blackboard and CF platform: Student's final grade
|
Normality tests |
||||||
|
Kolmogorov-Smirnov a |
Shapiro-Wilk |
|||||
|
Statistician |
gl |
Sig. |
Statistician |
gl |
Sig. |
|
| ACT |
.130 |
118 |
<.001 |
.920 |
118 |
<.001 |
| CF |
.136 |
118 |
<.001 |
.934 |
118 |
<.001 |
Note. a. Lilliefors significance correction
Once the normality study was done and given that the significance level was less than 0.05, we proceeded to reject H0 , which indicates that the data have a normal distribution, so the data have a distribution different from normal and therefore, nonparametric statistics should be used for the relational study.
Similarly, normality test was performed for the indicator "Course activity information" which shows the total time (TPO) that the student dedicated to the course while active on the platform during the academic period, finding the results shown in Table 6 and with similar results to the activity indicator.
Table 6
Normality tests for the variables TPO (Time recorded in the Blackboard platform) and CF (student's final grade)
|
Normality tests |
||||||
|
Kolmogorov-Smirnov a |
Shapiro-Wilk |
|||||
|
Statistician |
gl |
Sig. |
Statistician |
gl |
Sig. |
|
| TPO |
.115 |
118 |
<.001 |
.896 |
118 |
<.001 |
| CF |
.136 |
118 |
<.001 |
.934 |
118 |
<.001 |
Note.a. Lilliefors significance correction
To make the relational study between ACT ("User activity in the content areas") and CF (student's final grade), after investigating the distribution of the data, we proceeded as follows:
The relationship hypothesis of the study was established:
H0: There is no relationship between a student's activity on the Blackboard platform and their final subject grade.
H1: There is a relationship between a student's activity on the Blackboard platform and his or her final subject grade.
The significance level for all studies was considered to be 95%, that is, an α error of .05 is allowed and a statistical power (1- β) of 80% is sought.
Subsequently, correlational studies were performed, the results of which are shown in Tables 7 and 8.
Table 7
Spearman correlation between the Blackboard system activity indicator (ACT) and the student's final grade (CF)
|
Correlations |
||||
|
ACT |
CF |
|||
|
Rho of Spearman |
ACT | Correlation coefficient |
1.000 |
.448*** |
| Sig. bilateral |
|
<.001 |
||
| n |
118 |
118 | ||
| CF | Correlation coefficient |
.448*** |
1.000 |
|
| Sig. (bilateral) |
<.001 |
|
||
| n |
118 |
118 |
||
Note.***. The correlation is significant at the 0.001 level (bilateral).
Table 8
Spearman correlation between the Blackboard recorded time indicator (TPO) and the student's final grade (CF)
|
Correlations |
||||
| TPO |
CF |
|||
| Spearman's Rho | TPO | Correlation coefficient |
1.000 |
.447** |
| Sig. bilateral |
|
<.001 |
||
| n |
118 |
118 |
||
| CF | Correlation coefficient |
.447** |
1.000 |
|
| Sig. (bilateral) |
<.001 |
|
||
| n |
118 |
118 |
||
Note.**. The correlation is significant at the 0.01 level (bilateral).
Once the relational studies had been carried out and given that the significance level was less than 0.05, we proceeded to reject H0 , which indicates that the variables are not related, and therefore, H1 , which indicates that there is a relationship between the variables, is accepted.
With the results obtained from the correlational studies, the statistical power was calculated in the G*Power software and the results can be seen in Figures 1 and 2.
Figure 1
Calculation of the statistical power for the relationship between student activity (ACT) recorded in the Blackboard system and the student's final grade (CF)
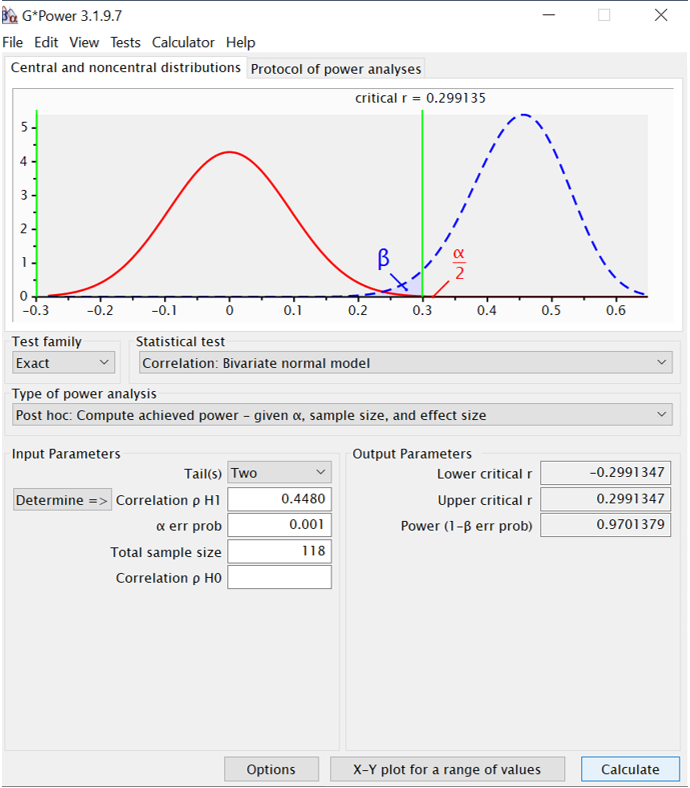
Figure 2
Calculation of statistical power for the relationship between student time spent (TPO) recorded in Blackboard and final grade (CF)
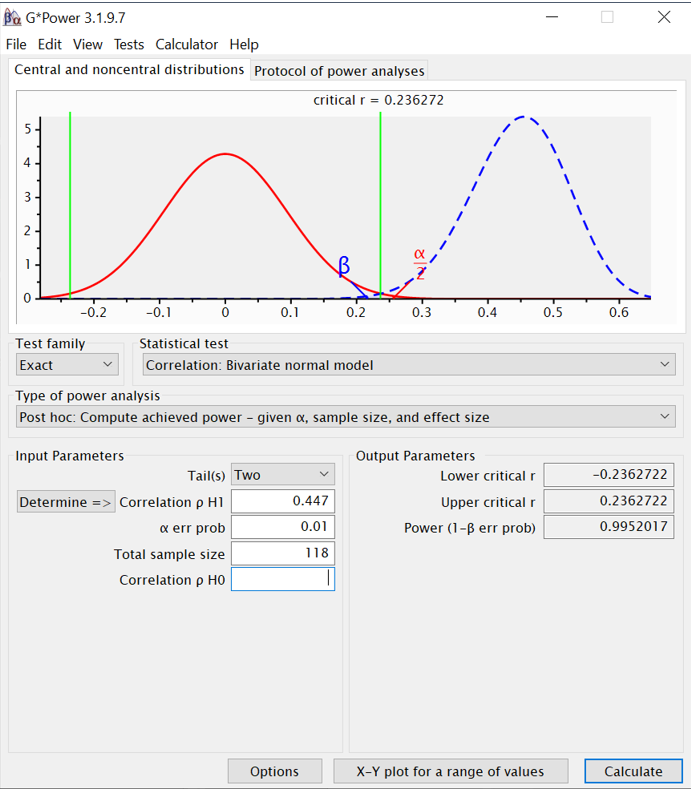
As can be seen in Tables 7 and 8, a moderate relationship was found considering the scale presented by Hair et al. (2020), significant and positive both between student activity on the platform and academic performance (rho(116)=.448, p<.001 with statistical power of .970), and between time spent on the platform and academic performance (rho(116) =.447, p<.01 with statistical power of .995). These results support the research hypothesis and it is concluded that there is a relationship between the activity and time spent by the student in Blackboard and their final grade.
Effect size in a relational study, Clark-Carter (2019) expounds, is a measure of the amount of variance in one variable that can be explained by the variance in the other variable. It is calculated by squaring the correlation coefficient and multiplying by 100; the effect size in this study is 20.07% for student activity and final grade and 19.88% for time spent on the platform and final grade; the author considers this effect size as an effect located between medium and large in the Social Sciences.
Even though the relationship is moderate, considering the number of factors involved in student performance, the findings can be considered as results that help the teacher to promote focused student behavior during the course.
Discussion and conclusions
Based on the results, it can be concluded that both student activity and time invested by the student and recorded in Blackboard are positively and significantly related to their academic performance outcomes as measured by the final grade, which is in agreement, as discussed by Atwell (2021), Halverson and Graham (2015), Henrie et al. (2015) and Kuh (2009) with the engagement theory that states that effort, persistence, and time on task are dimensions of cognitive engagement that manifest as an external form of learner behavior and reflect the actual investment of mental energy in learning, related in turn, significantly to academic performance.
The results also coincide with those obtained by various researchers who have studied the relationship between EMS analytics and academic performance: Ahmed and Mesonovich (2019) did a study in precalculus subject and found that there is relationship between the grades of the SGA activities and the student's final grade. Akai and Koral Gumusoglu (2020) found that, in language subjects, the use of an LMS predicts the student's final grade. Bulut et al. (2023) found that formative assessment outcomes (homework completion, turnaround time, grades) are significant predictors of the student's final grade. Darko (2021), using data from an LMS, analyzed the average time a student spent during their undergraduate studies in relation to their final grades and found a positive and significant correlation. Firat (2016), found that there is a relationship between analytics of an LMS and the final grade, particularly, the time invested by the learner. Fleur et al. (2023) designed an additional board to show students their analytics and claim that its social impact positively influenced motivation and final grades. Liz-Domínguez et al. (2022) found correlation between analytics of an EMS and final grade for students taking Computer Science for Architecture for the first time. Shayan and van Zaanen (2019) found that student activity is a predictor of their final grade from the second half of the academic term onwards. On the other hand, Saygili and Çetin (2021) did a meta-analysis to study the relationship between the analytics of an EMS and the final grade in Mathematics and found a low relationship. Broadbent (2016) asserts that it is student self-efficacy and not the analytics of an EMS that has a relationship with academic performance.
Limitations and proposals for continuity
Even though the results are considered positive because they guide towards future observations on indicators of student involvement related to their academic performance, they cannot be generalized to the population because the subject has only been studied in engineering programs at one university. Examining Blackboard analytics at different universities would provide a better picture for building a model related to the introductory programming subject. It should also be considered that the population studied belongs to a region of Mexico and the analytics come from Blackboard, extending the study to the whole country and including analytics from other platforms would be enriching. The student's background has not been studied and would be another factor to consider. The correlation found does not guarantee a cause-effect relationship between the study variables. Future research could also study student motivation and perceptions of the Blackboard platform, as well as comparing the results with other indicators of student engagement. Qualitative research could also be done through interviews with students who do not exhibit active behavior on the Blackboard platform.
References
Ahmadi, G., Mohammadi, A., Asadzandi, S., Shah, M., & Mojtahedzadeh, R. (2023). What Are the Indicators of Student Engagement in Learning Management Systems? A Systematized Review of the Literature. International Review of Research in Open and Distributed Learning, 24(1), 117 – 136. https://doi.org/10.19173/irrodl.v24i1.6453
Ahmed, K., & Mesonovich, M. (2019). Learning Management Systems and Student Performance. International Journal of Sustainable Energy Development (IJSED), 7(1), 582 – 591.
Akai, E., & Koral Gumusoglu, E. (2020). The impact of learning management systems on students´achievement in language exams. Turkish Online Journal of Distance Education-TOJDE, 21(4), 12, 206 – 222.
ANUIES (2022). Asociación Nacional de Universidades e Instituciones de Educación Superior. Año escolar 2021 – 2022. México. http://www.anuies.mx/informacion-y-servicios/informacion-estadistica-de-educacion-superior/anuario-estadistico-de-educacion-superior
Astin, A. (1984). Student involvement: A developmental theory for higher education. Journal of college student personnel, 25(4), 297–308.
Atwell, A., Mrusek, B., Solti, J., & Wilson, K. (2021). Risks to Student Achievement in Higher Education. Advances in Human Factors in Training, Education, and Learning Sciences, 269. https://doi.org/10.1007/978-3-030-80000-0_20
Barbera, S. A., Berkshire, S. D., Boronat, C. B., & Kennedy, M. H. (2020). Review of undergraduate student retention and graduation since 2010: Patterns, predictions, and recommendations for 2020. Journal of College Student Retention: Research, Theory & Practice, 22(2), 227–250.
Bayoumy, H., & Alsayed, S. (2021). Investigating Relationship of Perceived Learning Engagement, Motivation, and Academic Performance Among Nursing Students: A Multisite Study. Advances in Medical Education and Practice, 12, 351 – 369.
Bean, J., & Metzner, B.(1985). A Conceptual Model of Nontraditional Undergraduate Student Attrition. Review of Educational Research, 55(4), 485 – 540. https://doi.org/10.3102/00346543055004485
Broadbent, J. (2016). Academic success is about self-efficacy rather than frequency of use of the learning management system. Australasian Journal of Educational Technology, 32(4).
Bulut, O., Gorgun, G., Yildirim-Erbasli, S., Wongvorachan. T., Daniels, L., Gao, Y., Ka Wing, L., & Shin. J. (2023) Online formative assessments as the foundation for predictive learning analytics models. British Journal of Educational Technology, 54(1), 19 – 39. https://doi.org/10.1111/bjet.13276
Burch, G., Heller, N., Burch, J., Freed, R., & Steed, S. (2015). Student Engagement: Developing a Conceptual Framework and Survey Instrument. Journal of Education for Business, 90(4), 224 – 229. https://doi.org/10.1080/08832323.2015.1019821
Cárdenas Castro, M., & Arancibia Martini, H. (2014) Potencia estadística y cálculo del tamaño del efecto en G*Power: complementos a la prueba de significación estadística y su aplicación en Psicología. Salud y Sociedad, 5(2), 210 - 224.
Christenson, S. L., Reschly, A. L., Appleton, J. J., Berman-Young, S., Spangers, D., & Varro, P. (2008). Best practices in fostering student engagement. A. Thomas, & J. Grimes (Eds.), Best practices in school psychology, V, 1099-1120.
Christenson, S. L., Reschly, A. L., & Wylie, C. (2012). Handbook of Research on Student Engagement. Springer.
Clark-Carter D.(2019). Quantitative Psychological Research. Routledge.
Curione, K., Huertas, J., Ortuño, V., Gründler, V., & Píriz, L. (2019). Validación del bloque Estrategias de aprendizaje del MSLQ con estudiantes universitarios uruguayos. Revista Interamericana de Psicología/Interamerican Journal of Psychology (IJP), 53(1), 66 - 80.
Curtis H.(2016). Measuring Student Engagement in Technology-Mediated Learning Environments. [Tesis doctoral, Brigham Young University]. https://scholarsarchive.byu.edu
Dahlstrom, E., & Bichsel, J. (2014). ECAR Study of Undergraduate Students and Information Technology, ECAR Survey, https://net.educause.edu/ir/library/pdf/ss14/ERS1406.pdf
Darko, C. (2021). An Evaluation of How Students Use Blackboard and the Possible Link to Their Grades. SAGE Open, 11(4). https://doi.org/10.1177/21582440211067245
Delfino A. (2019). Student Engagement and Academic Performance of Students of Partido State University. Asian Journal of University Education, 15(1).
Faul, F., Erdfelder, E., Buchner, A., & Lang, A. (2009). Statistical power analyses using G*Power 3.1: Tests for correlation and regression analyses. Behavior Research Methods, 41, 1149 - 1160.
Ferreyra, M., Avitabile, C., Botero Álvarez, J., Haimovich Paz, F., & Urzúa, S. (2017). Momento decisivo. La educación superior en América Latina y el Caribe. Grupo Banco Mundial.
Firat, M. (2016). Determining the effects of LMS learning behaviors on academic achievement in a learning analytic perspective. Journal of Information Technology Education Research, 15, 75-87. http://www.jite.org/documents/Vol15/JITEv15ResearchP075-087Firat1928.pdf
Fleur, D., van den Bos, W., & Bredeweg, B. (2023). Social comparison in learning analytics dashboard supporting motivation and academic achievement. Computers and Education Open. 4(100130) 1 – 11. https://www.sciencedirect.com/journal/computers-and-education-open
Flores Tapia, C., & Flores Ceballos, K. (2021). Pruebas para comprobar la normalidad de datos en procesos productivos: Anderson-Darling, Ryan-Joyner, Shapiro-Wilk y Kolgomorov-Smirnov. Societas. Revista de Ciencias Sociales y Humanísticas Universidad de Panamá, 3(2) 83 – 97.
Franklin, M., Chan, J., Gardner, K., Measom, E., Sandberg, B., Irvine, J., & Kimmons, R. (2021). Higher Education: A History of Research Trends from 1970 to 2020. In R. Kimmons & J. Irvine (Eds.), 50 Years of Education Research Trends. Open Scholars Press. https://openscholarspress.org/50_years/higher_education
Fredricks, J., Blumenfeld, P., & Paris, A. (2004). School engagement: Potential of the concept, state of the evidence. Review of educational research, 74(1), 59 – 109.
Fredricks, J., Filsecker, M., & Lawson, M. (2016). Student engagement, context, and adjustment: Addressing definitional, measurement, and methodological issues. Learning and Instruction, 43, 1 – 4.
Gardner, C., Jones, A., & Jefferis, H. (2020). Analytics for Tracking Student Engagement. Journal of Interactive Media in Education, 1(22). http://doi.org/10.5334/jime.590
Glapaththi, I., Dissanayake, R., Welgama, T., Somachandara, U., Weerarathna, R., & Pathirana, G. (2019). A Study on the Relationship between Student Engagement and Their Academic Achievements. Asian Social Science, 15(11), 1 - 16.
Gunuc, S. (2014). The relationships between student engagement and their academic achievement. International Journal on New Trends in Education and Their Implications, 5(4), 4 – 19.
Hair Jr., J., Black, W., Babin, B. & Anderson, R. (2019). Multivariate Data Analysis, Eighth Edition. Cengage.
Hair Jr., J., Page, M., & Brunsveld, N. (2020). Essentials of Business Research Methods. Fourth Edition. Routledge.
Halverson, L., & Graham, C. (2019). Learner engagement in blended learning environments: A conceptual framework. Online Learning, 23(2), 145-178. https://doi.org/10.24059/olj.v23i2.1481
Henrie, C., Halverson, L., & Graham, Ch. (2015). Measuring student engagement in technology-mediated learning: A review. Computers & Education, 90, 36 – 53.
Hernández Barrios, A., & Camargo Uribe, A. (2017). Autorregulación del aprendizaje en la educación superior en Iberoamérica: una revisión sistemática. Revista Latinoamericana de Psicología, 49(2), 146 - 160.
Hernández Sampieri, R., & Mendoza Torres, C. (2018). Metodología de la investigación. Las rutas cuantitativa, cualitativa y mixta. McGraw Hill Education.
Kahu, E., & Nelson, K. (2018). Student engagement in the educational interface: Understanding the mechanisms of student success. Higher Education Research & Development, 37(1), 58 - 71.
Kanaparan, G., Cullen, R., & Mason, D. (2017). Self efficacy & Engagement on Students. Australasian Journal of Information Systems. Vol 23, Selected Papers from ACIS.
Karabıyık, C. (2019). The relationship between student engagement and tertiary level English Language Learners´s Achievement. International Online Journal of Education and Teaching (IOJET), 6(2), 281-293.
Kuh, G. (2009). The National Survey of Student Engagement: Conceptual and Empirical Foundations. New Directions for Institutional Research. Wiley Periodicals, 141. https://doi.org/10.1002/ir.283
Kumar, S., Agarwal, M., & Agarwal, N. (2021). Defining And Measuring Academic Performance of Hei Students-A Critical Review. Turkish Journal of Computer and Mathematics Education, 12(6), 3091 – 3105.
Li, I., & Carroll, D. (2017). Factors Influencing University Student Satisfaction, Dropout and Academic Performance: An Australian Higher Education Equity Perspective. National Centre for Student Equity in Higher Education (NCSEHE), Curtin University: Perth.
Liz-Domínguez, M., Llamas-Nistal, M., Caeiro-Rodríguez, M., & Mikic-Fonte, M.(2022) LMS Logs and Student Performance: The Influence of Retaking a Course. In Global Engineering Education Conference,https://doi.org/10.1109/EDUCON52537.2022.9766691
Lu, O., Huang, J., Huang, A., & Yang, S. (2017) Applying learning analytics for improving students engagement and learning outcomes in an MOOCs enabled collaborative programming course, Interactive Learning Environments, 25(2), 220 – 234. https://doi.org/10.1080/10494820.2016.1278391
Mandernach, B. (2015). Assessment of Student Engagement in Higher Education: A Synthesis of Literature and Assessment Tools. International Journal of Learning, Teaching and Educational Research, 12(2), 1-14.
Meseret, G., & Ananda, R. (2018). University Students’ Engagement and Academic Achievement in Ethiopian Public Universities. Journal of Advances and Scholarly Researches in Allied Education, Multidisciplinary Academic Research, 15(12), 115 – 122.
Morales Vallejo (2012). Estadística aplicada a las Ciencias Sociales. Universidad Pontificia Comillas, Madrid, Facultad de Humanidades, http://www.upcomillas.es/personal/peter/investigacion/Tama%F1oMuestra.pdf
Nuevo León (2017). Presentación sobre el Plan de Desarrollo Industrial del Gobierno del Estado de Nuevo León, iniciativa Nuevo León 4.0: un ecosistema de colaboración entre Gobierno, Academia e Industria. México. http://www.nl.gob.mx/publicaciones/nuevo-leon-40
Nuevo León (2022). Plan estratégico 2030. Consejo Nuevo León. https://planestrategico.conl.mx/desarrollo-economico
OECD (2017). Education at a Glance 2017: OECD Indicators. OECD Publishing.
Pértegas Díaz, S., & Pita Fernández, S. (2002). Investigación: Determinación del tamaño muestral para calcular la significación del coeficiente de correlación lineal. Unidad de Epidemiología Clínica y Bioestadística. Complexo Hospitalario Juan Canalejo. A Coruña.
PwC (2020). Skills for Industry Curriculum Guidelines 4.0. European Commission. Executive Agency for Small and Medium-sized Enterprises (EASME). https://doi.org/10.2826/097323
Qetesh, M., Saadh, M., Kharshid, A., & Acar, T. (2020). Impact of the Covıd-19 Pandemic on Academic Achievement and Self-Regulated Learning Behavior for Students of The Faculty of Pharmacy, Middle East University. Multicultural Education, 6(5).
Santabárbara, J. (2021). Cálculo del tamaño de muestra necesario para estimar el coeficiente de correlación de Pearson mediante sintaxis en SPSS. REIRE Revista d’Innovació i Recerca en Educació, 14(1), 1 – 7. https://doi.org/10.1344/reire2021.14.132565
Sakiz, H., Özdaş, F., Göksu, İ., & Ekinci, A. (2021). A Longitudinal Analysis of Academic Achievement and Its Correlates in Higher Education. SAGE Open.
Saygili, H., & Çetín, H. (2021). The Effects of Learning Management Systems (LMS) on Mathematics Achievement: A Meta-Analysis Study. Necatibey Faculty of Education Electronic Journal of Science and Mathematics Education, 15(2), 341-362. https://doi.org/10.17522/balikesirnef.1026534
Schneider, M., & Preckel, F. (2017). Variables associated with achievement in Higher Education: A systematic review of meta-analyses. Psychological Bulletin. APA, 143(6), 565 – 600.
Shayan, P., & van Zaanen, M. (2019). Predicting Student Performance from Their Behavior in Learning Management Systems. International Journal of Information and Education Technology, 9(5), 337 – 341.
Sithole, A., Chiyaka, E., McCarthy, P., Mupinga, D., Bucklein, B., & Kibirige, J. (2017). Student Attraction, Persistence and Retention in STEM Programs: Successes and Continuing Challenges. Higher Education Studies, 7(1). https://doi.org/10.5539/hes.v7n1p46
Skinner, E., Kindermann, T., & Furrer, C. (2009). A Motivational Perspective on Engagement and Disaffection. Educational and Psychological Measurement. 69(3), 493-525.
SPSS v28 (2022). Statistical Package for Social Sciences. IBM Academic Initiative.
Tempelaar, D., Nguyen, Q., & Rienties, B. (2020). Learning Analytics and the Measurement of Learning Engagement. Ifenthaler D. & Gibson D. (Eds) Adoption of Data Analytics in Higher Education Learning and Teaching. Advances in Analytics for Learning and Teaching. Springer, Cham. https://doi.org/10.1007/978-3-030-47392-1_9
Tight, M. (2020). Student retention and engagement in higher education. Journal of Further and Higher Education, 44(5), 689–704. https://doi.org/10.1080/0309877X.2019.1576860
Tinto, V. (1975) Dropout from Higher Education: a theoretical synthesis of recent research. Review of Educational Research, 45(1), 89 -125.
Tinto, V. (2016). How to improve student persistence and completion (essay). https://www.insidehighered.com/views/2016/09/26/how-improve-student-persistence-and-completion-essay
Trowler, V. (2010). Student engagement literature review. The higher education academy, 11, 1 – 15.
Venugopal, G., & Rajashree, J. (2015). Influence of learning management system on student engagement. In IEEE 3rd International Conference on MOOCs, Innovation and Technology in Education (MITE). https://doi.org/10.1109/MITE.2015.7375358
Yamauchi, L., Taira, K., & Trevorrow, T. (2016). Effective instruction for engaging culturally diverse students in Higher education. International Journal of Teaching and Learning in Higher Education, 28(3), 460 – 470.
Zare, S., Zeinalipoor, H., & Naseri Jahromi R. (2017). Study of the relationship between self-regulated learners strategies with academic achievement. Research in Medical Education, 9(4), 57 - 49.
Zepke, N. (2018). Student Engagement in Neo-Liberal Times: what is missing? Higher Education Research and Development, 37(2), 433 - 446.